Following the vibration path
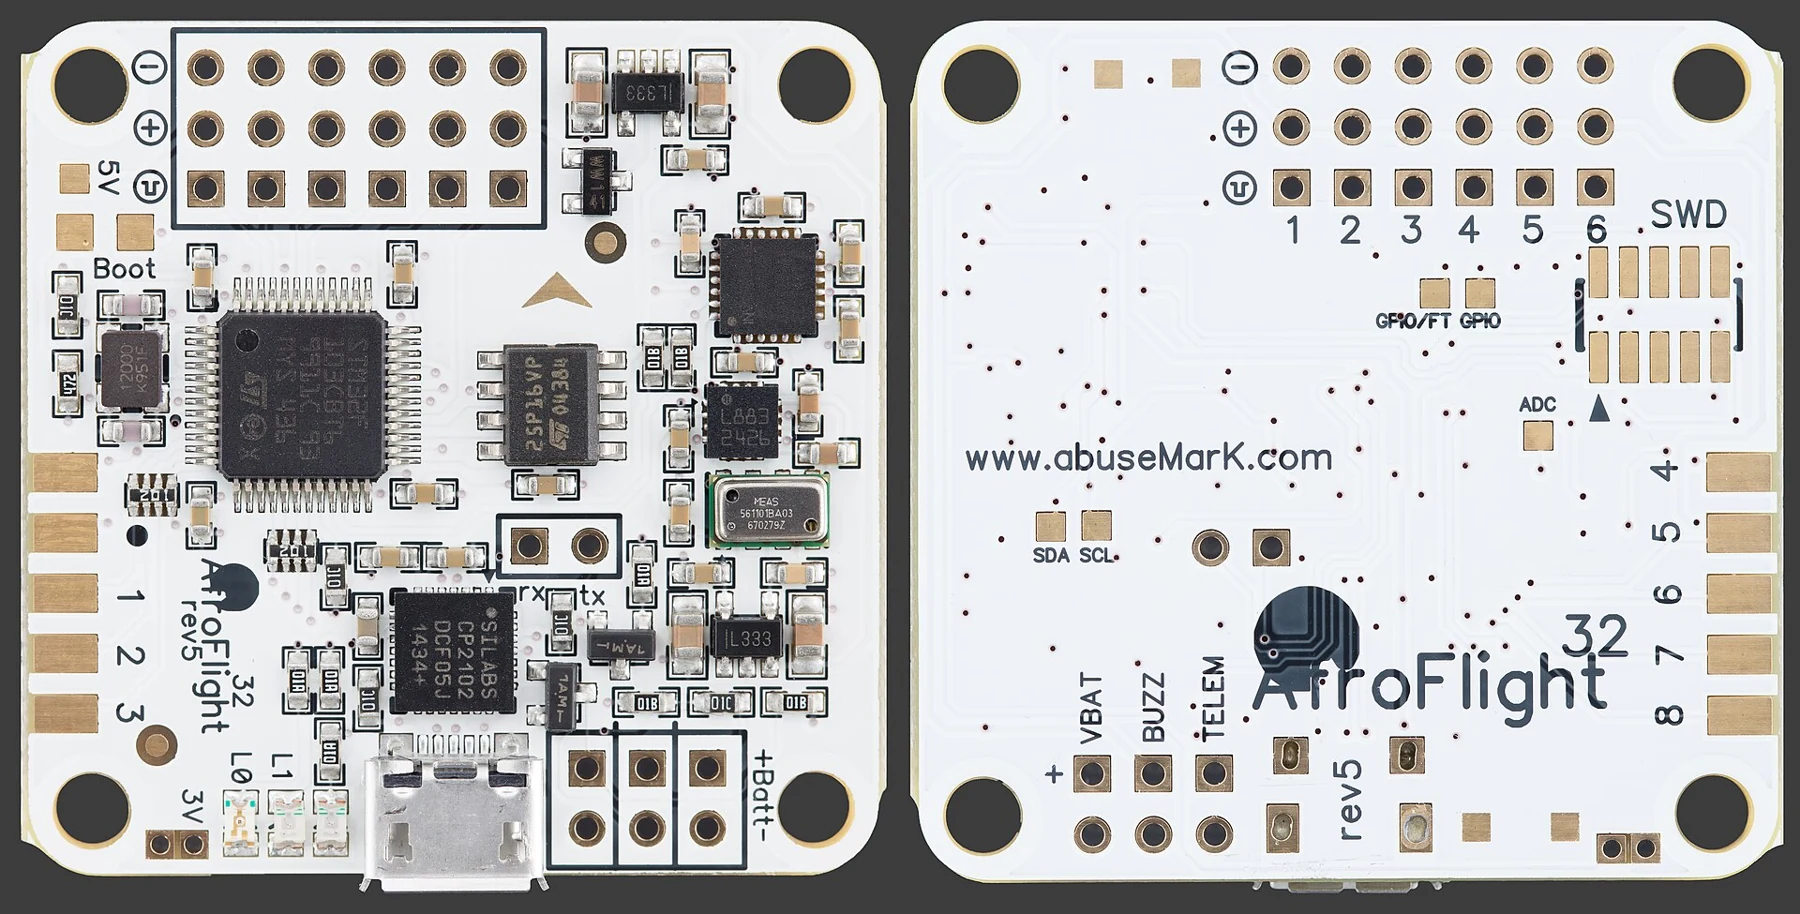
During my product internship at Vayu Aerospace, I worked on how motor and airframe vibration reached the flight-controller IMU. A mount could fit the controller perfectly and still pass too much vibration into it. I needed to understand the support, the controller, and the connections around them as one assembly.
I compared a rigid baseline, an elastomer-isolated tray, and a suspended mount in ANSYS. Natural frequencies and mode shapes helped explain how each arrangement changed the vibration path. The response analysis then helped us shortlist the isolation concepts for hardware evaluation.
From the model to the assembly
When we integrated the shortlisted mounts, I checked the CAD fit, clearances, fasteners, cable slack, and controller orientation. These details mattered because a tight cable or an unintended contact could create another path for vibration, even if the mount itself was compliant.
The assembled mounts were tested through ground motor runs. I used MATLAB to inspect the IMU time histories and FFT spectra, alongside the RMS levels. For a sampled acceleration signal, RMS is:
Here, N is the number of samples and aᵢ is the acceleration sample being compared. An RMS value only makes sense beside the processing choices and operating window: the same axis, units, motor condition, and treatment of the signal. The FFT adds another view by showing which frequencies contribute to the response.
What the comparison supported
The team selected the elastomer-isolated modular tray after combining the simulation, hardware integration, and IMU analysis. My contribution covered mount modeling, integration, ground tests, and analysis of the logs.
The useful lesson for me was how easily an isolation idea can change during assembly. Checking the vibration path in the real hardware was as important as comparing the modeled supports.